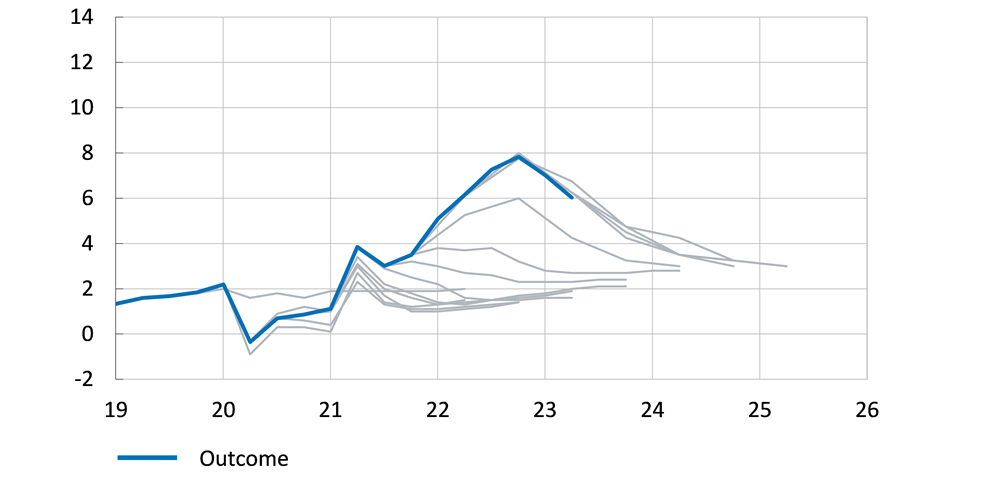
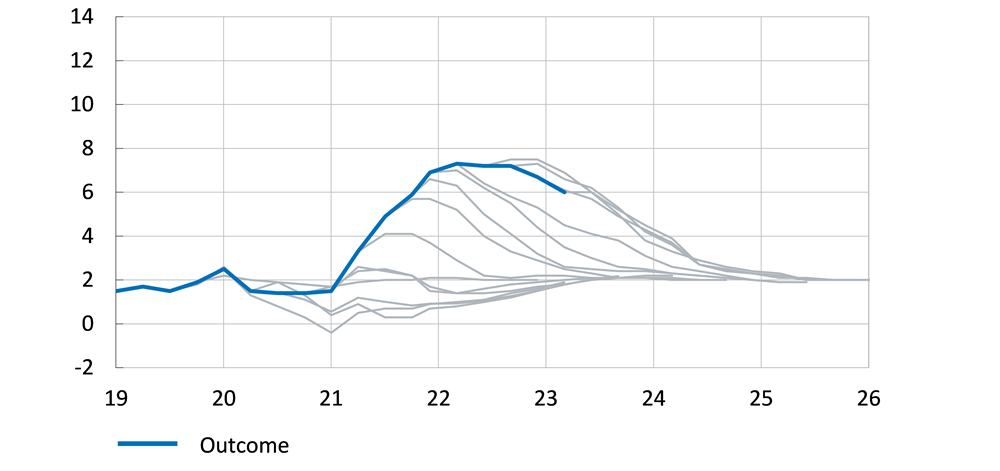
Figure 7. Australia. CPI, outcomes and Reserve Bank of Australia’s forecastsAnnual percentage change
Source: Reserve Bank of Australia
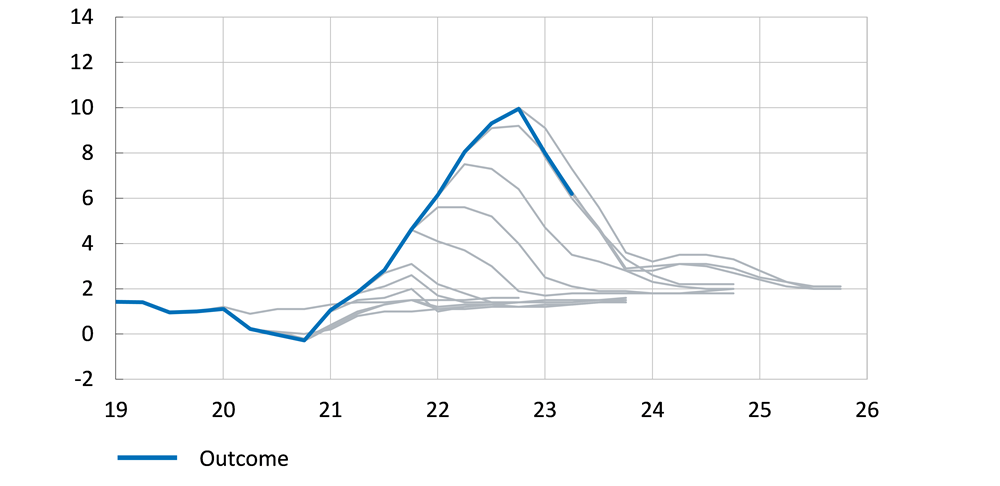
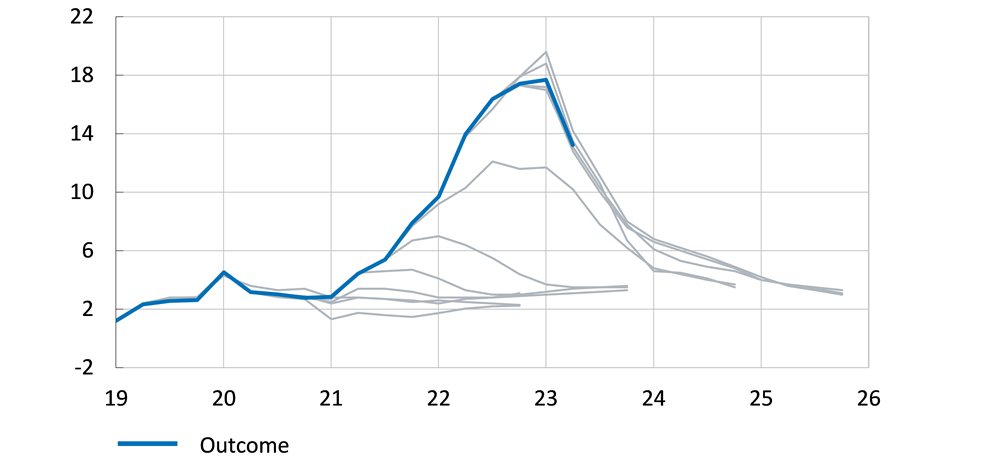
Figure 8. Euro area. HCPI, outcomes and European Central Bank forecasts Annual percentage change
Note. The forecasts we evaluate are those prepared by European Central Bank staff (March and September forecasts) and by Eurosystem staff (June and December forecasts). Source: European Central Bank
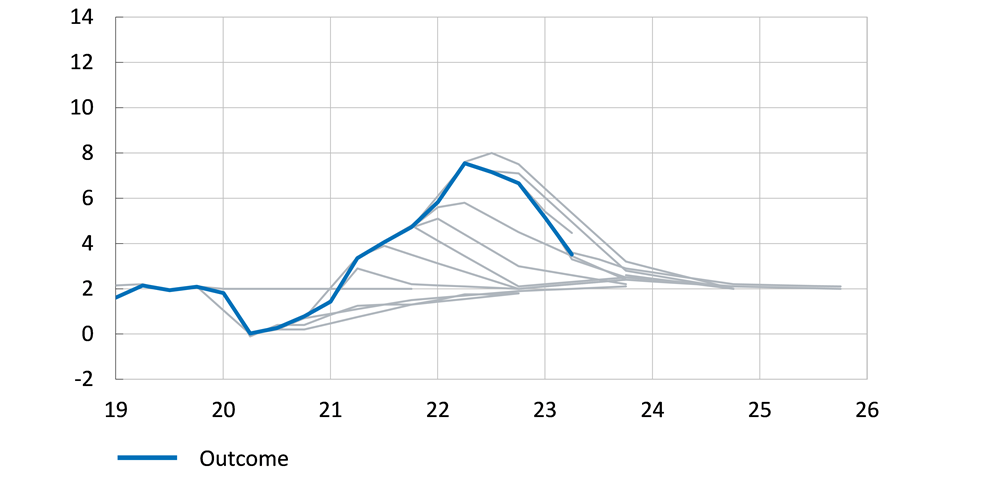
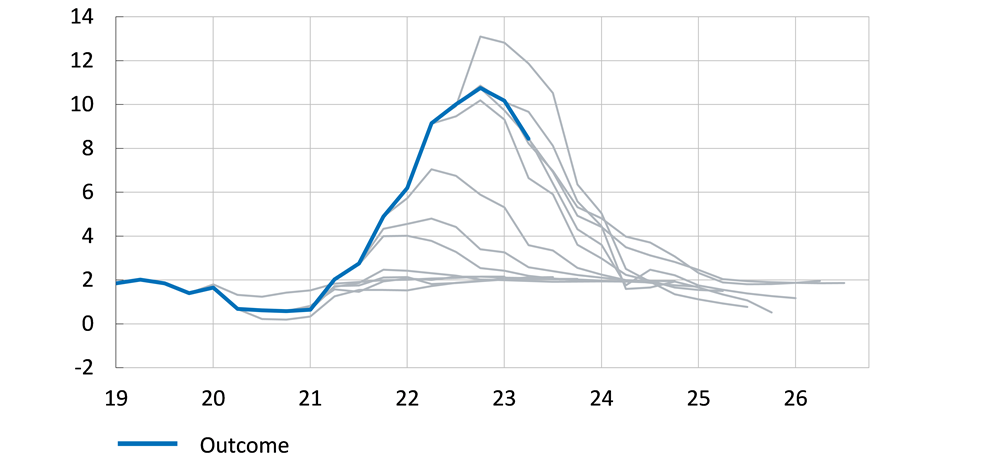
Figure 9. Canada. CPI, outcomes and Bank of Canada linearly interpolated forecastsAnnual percentage change
Note. The Bank of Canada publishes quarterly forecasts for the current year (depending on when the forecast is made during the year) and for the fourth quarter for the next two years. In addition, the Monetary Policy Report published in July 2020 included the annual averages for CPI inflation in 2021 and 2022, which is information that we take into account. For simplicity, we have linear interpolation between the dates for which there are no quarterly forecasts. Spline interpolation, which is more flexible, does not produce noticeably different results. Source: Bank of Canada
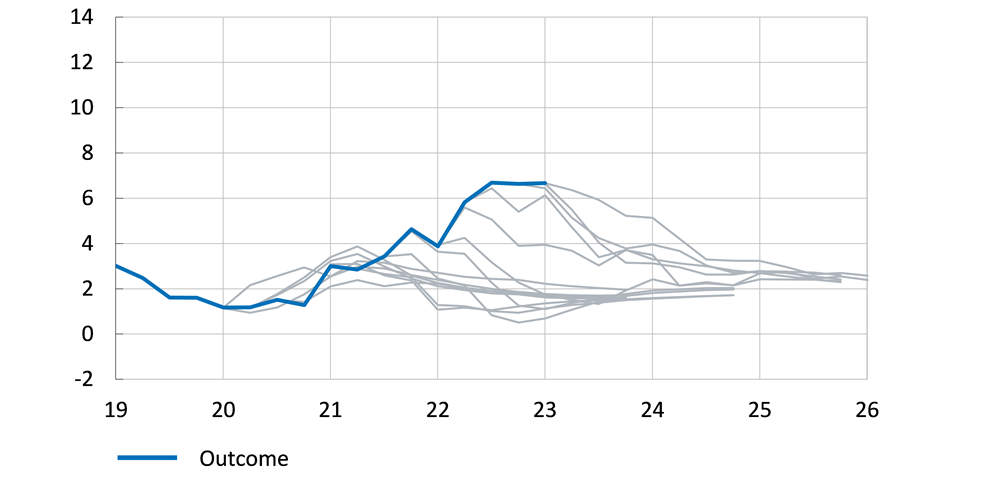
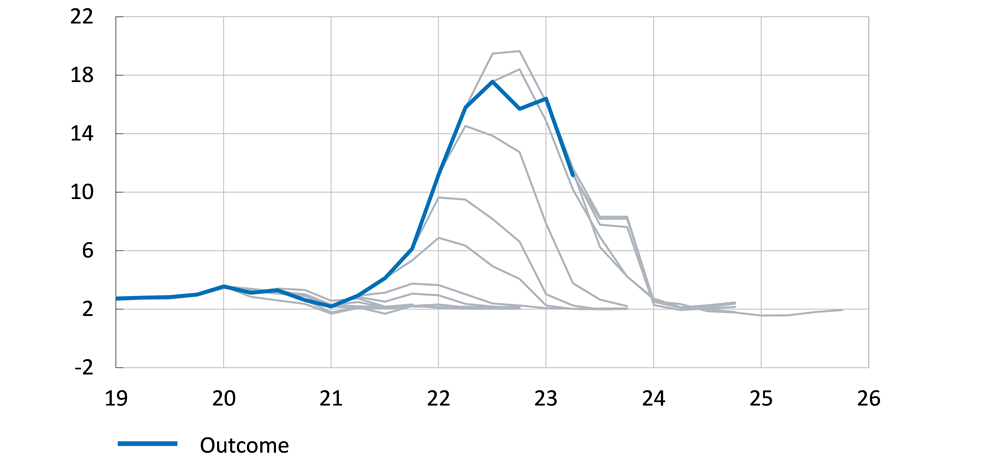
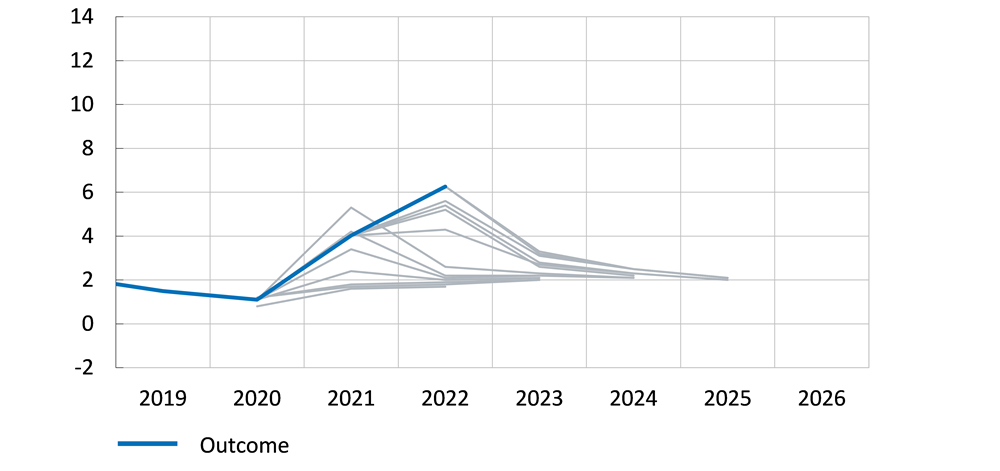
Figure 10. Norway. CPI, outcomes and Norges Bank’s forecasts Annual percentage change
Source: Norges Bank
Figure 11. New Zealand. CPI, outcomes and Reserve Bank of New Zealand’s forecastsAnnual percentage change
Note. Between May 2020 and January 2021, the Reserve Bank of New Zealand published no forecasts but three different scenarios. The speed of recovery and the duration of the restrictions were important differences between the three scenarios. See Reserve Bank of New Zealand (2022) for a detailed description. We evaluate the main scenario. Source: Reserve Bank of New Zealand
Figure 12. Poland. CPI, outcomes and Narodowy Bank Polski’s forecasts Annual percentage change
Source: Narodowy Bank Polski
Figure 13. United Kingdom. CPI, outcomes and Bank of England’s forecastsAnnual percentage change
Note. The forecasts we evaluate are those presented in the Monetary Policy Reports. Source: Bank of England
Figure 14. Czech Republic. CPI, outcomes and Česká národní banka’s forecasts Annual percentage change
Source: Česká národní banka
Figure 15. United States. PCE, outcome and Federal Reserve forecasts Annual percentage change
Note. The forecasts we evaluate, shown in the figure above, are the median PCE inflation between June 2020 and June 2023. Unlike other central banks, the Federal Reserve publishes forecasts for inflation in the fourth quarter of each year (compared to the fourth quarter of the previous year). We evaluate these against average inflation for 2021 and 2022. The results are similar if we instead interpolate the forecasts linearly. Outcomes pertain to vintage 2023-07-30.
Source: Federal Reserve Board, Federal Open Market Committee Projections materials