How good are the measures at predicting future CPIF inflation?
Published: 21 February 2024
In Table 1 we present a measure of how well the different measures of core inflation are able to forecast future CPIF inflation. The calculation is made for January 2000 to December 2023 and shows how good the latest monthly outcomes of the various measures are at forecasting the annual rate of increase in the CPIF 6, 12, 18, 24, 30 and 36 months ahead. The calculation thus captures how well the various measures already reflect the future development of the annual percentage change in the CPIF.
The figures we present are the relative mean squared forecast error (RMSE) for forecasts when the current outcome of each measure is used to forecast the CPIF 6-36 months ahead.[10] The calculations are made on real-time versions of the data, i.e. where we have only seasonally adjusted up to the last available outcome in each period. The top six measures, without a suffix, are those based on annual percentage changes. The next six, with the suffix _anr, are those based on monthly seasonally adjusted changes. The figures thus show the relative forecasting ability of the other measures in relation to the forecasting ability of the CPIF. The forecasting ability (RMSE) of the CPIF itself is shown in the last row. Figures below 1 indicate that the measure is better at predicting future CPIF inflation than the rate of increase in the CPIF itself. The lower and therefore better the value of the measure, the greener the colour of the table. Conversely, the redder the colour of the measure, the higher, and therefore worse, the value it has for each forecast horizon.
In this analysis, the measures TRIM85 and UND24 calculated on monthly changes appear relatively good at the shortest horizon of 6 months. At longer horizons, the measures calculated from annual percentage changes appear to be relatively good, in particular the UND24 and CPIFPC measures.
Table 1. Relative ability to forecast future annual percentage changes in the CPIF for each inflation measure at different forecast horizons for the period 2000-2023.
Percentage points or ratio
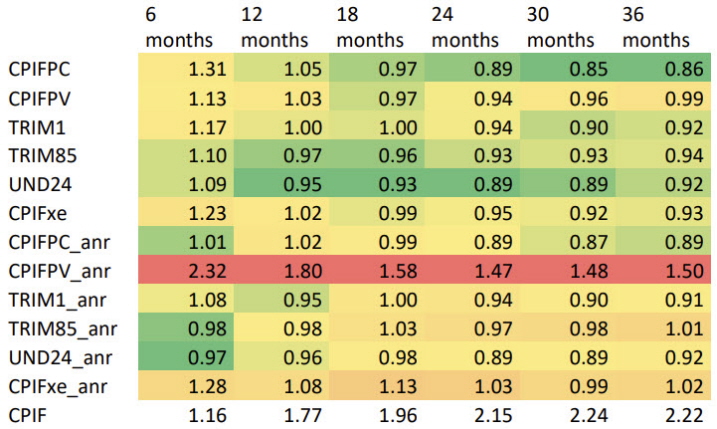
Note. The figures for the CPIF refer to the RMSE (Root Mean Squared Error) for the annual percentage change in the CPIF. Other figures refer to the relative RMSE to the RMSE of the CPIF. Thus, the figure of 1.15 for the CPIFPC at the 6-month horizon means that the RMSE is 1.15*1.12=1.29. The estimation period is 2000-2023. The measures with the suffix _anr are calculated from monthly changes in seasonally adjusted data. The results were then annualised and a 3-month moving average was calculated.
Source: The Riksbank
The results in Table 1 are affected by the fact that some of the measures based on monthly changes have had good forecasting ability in recent years, when inflation first rose rapidly and then fell back quickly. Therefore, if we compare the projections with data from 2018 to 2023, the picture is different and the measures calculated on a monthly percentage change basis appear relatively better (see Table 2). In particular, the measures TRIM85_anr and UND24_anr appear to be relatively good. At the same time, it is clear that the forecast errors have become significantly larger compared to the longer period in Table 1.
Table 2. Relative ability to forecast future annual percentage changes in the CPIF for each inflation measure at different forecast horizons for the period 2018-2023.
Percentage points or ratio
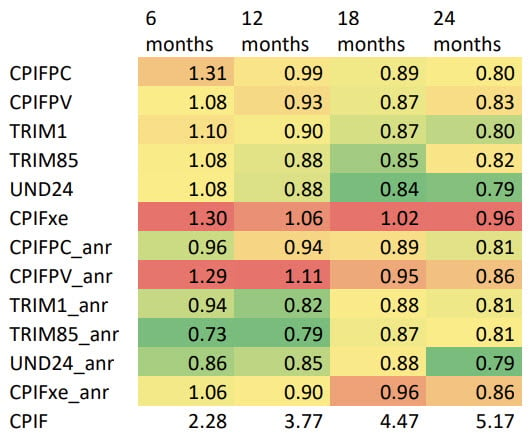
Note. See the note in Table 1
Source: The Riksbank.