Calculation of the carbon footprint of the foreign exchange reserves
Published: 12 April 2022
Weighted Average Carbon Intensity (WACI) is used when the Riksbank calculates and reports the carbon footprint of the foreign exchange reserves.[21] See the Appendix for information on the method used in this Commentary to calculate Weighted Average Carbon Intensity. The carbon footprint provides an indication of the level of emission intensiveness of the assets to which the Riksbank’s foreign exchange reserves are exposed. This is part of the Riksbank’s work of calculating and reporting climate-related risks for the Riksbank’s financial assets.
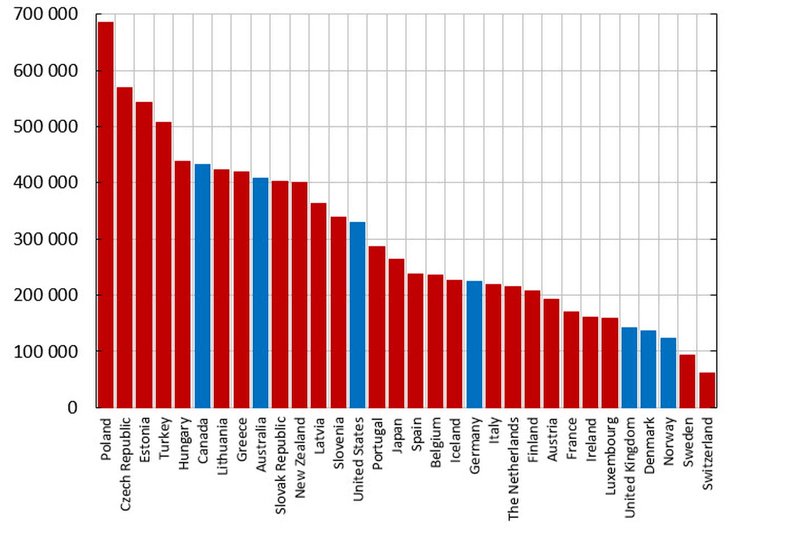
The starting point for calculating the carbon footprint is emission data. Figure 3 illustrates greenhouse gas emissions for a number of OECD countries reporting emission data to the United Nations Framework Convention on Climate Change (UNFCCC).[22] See the Appendix for information on the data used in this Commentary to calculate Weighted Average Carbon Intensity. The blue columns show the countries whose bonds are included in the Riksbank’s foreign exchange reserves as per 31 March 2022. However, emission data do not take into account the fact that countries are different in size and have different conditions in other respects, such as exposure to fossil resources, population size and the size of the economy. This is why the next step places the country’s annual greenhouse gas emissions (Figure 3) in relation to its GDP for the corresponding year.
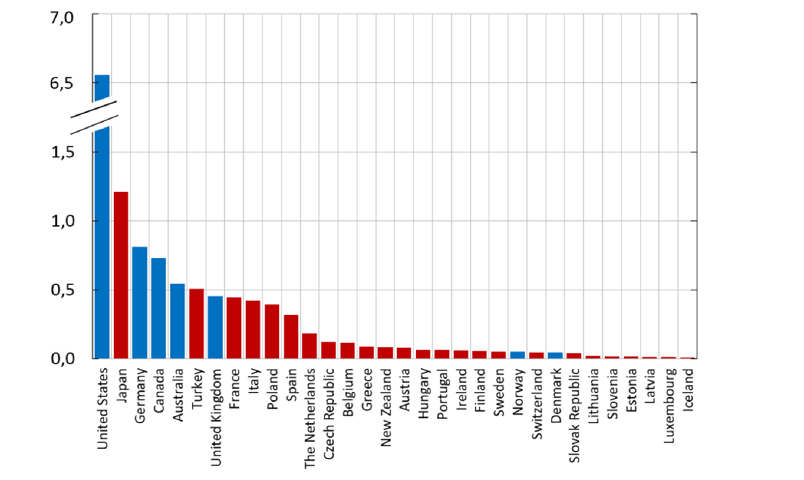
The result is expressed in the unit tonnes of carbon dioxide equivalents emitted per billion US dollars of GDP (Figure 4). This conversion allows fairer comparisons to be made, as emissions per unit of output for each country then become visible. Having said that, it is not entirely uninteresting to compare absolute levels of annual greenhouse gas emissions (Figure 3), as these are also important in the work of establishing climate-related risks in financial asset portfolios and allowing portfolio adjustments that support climate targets.
In Figure 4, the countries represented in the Riksbank’s holdings in the form of government bonds or bonds issued by regional authorities are marked blue. The United States, which by far releases the most greenhouse gases in total (Figure 3), has a lower carbon intensity than both Australia and Canada (Figure 4), both of which emit less greenhouse gases in absolute terms. This means that US production of a unit of goods and services contributes fewer emissions than that of Australia and Canada. The measure thereby takes into account the fact that larger countries tend to emit more than smaller countries because they tend to produce more and that larger asset portfolios usually account for higher greenhouse gas emissions than smaller portfolios. It is therefore appropriate to use carbon intensity when making comparisons over time and when comparing different asset portfolios. A comparison of carbon intensity is more accurate than just looking at emissions, but it still has its shortcomings. For example, carbon intensity does not take consumption into account, only production. This means, for instance, that the measure does not take into account the fact that some countries, for natural reasons, are in a position to provide the emission-intensive production demanded by other countries that purchase their product. As an example, some countries have abundant natural resources and therefore extract large quantities of raw materials that are then exported to meet demand from other countries. In other words, emission-intensive production only affects the country that produced the emissions, and not the country that imported the products. Nor does the measure take into account the fact that countries with a small population but high GDP, for example because major multinational corporations are domiciled in the country, have a carbon intensity that is lower, all else being equal.
Once carbon intensity has been calculated for each issuer, the carbon intensity of each holding is multiplied by the weight of the holding in the foreign exchange reserves. Finally, the weighted carbon intensity of each holding is added to give a weighted average carbon intensity for the entire foreign exchange reserves. See also the Appendix for a closer description of the data and the calculation method used in this Commentary to calculate Weighted Average Carbon Intensity.