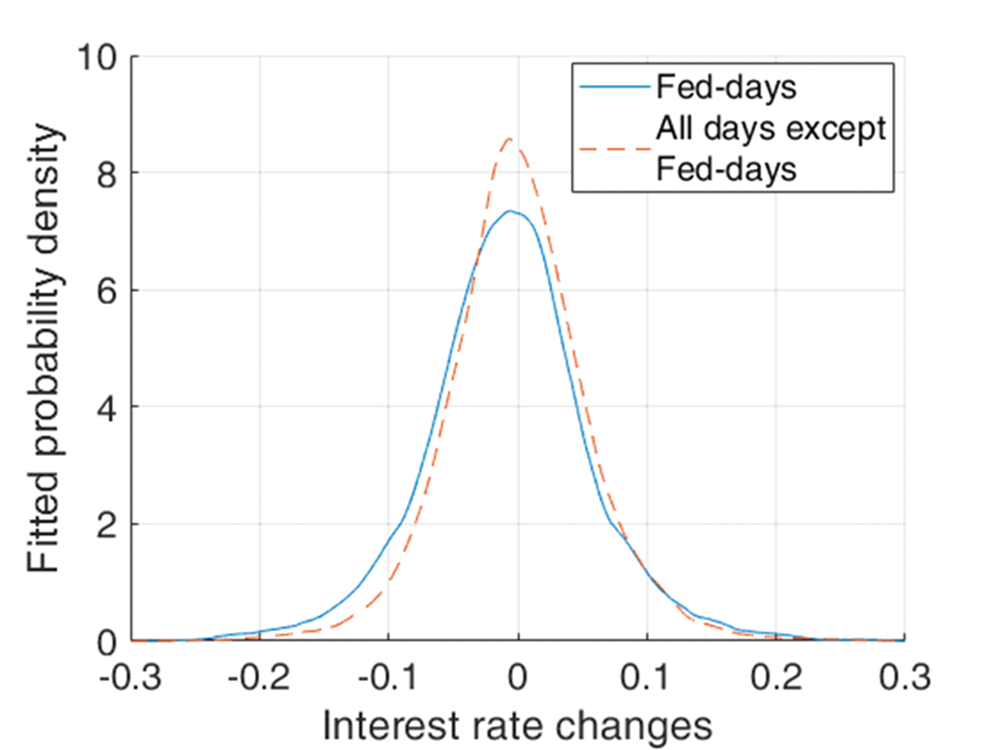
Figure 6. Distribution of interest rate changes, 10-year government bond, USA
Percentage points
Note. The figure shows two non-parametric estimates of a probability distribution based on daily changes in interest rates between 1 June 1989 and 14 March 2024 on Fed meeting days and on all other days. Sources: Federal Reserve and own calculations.
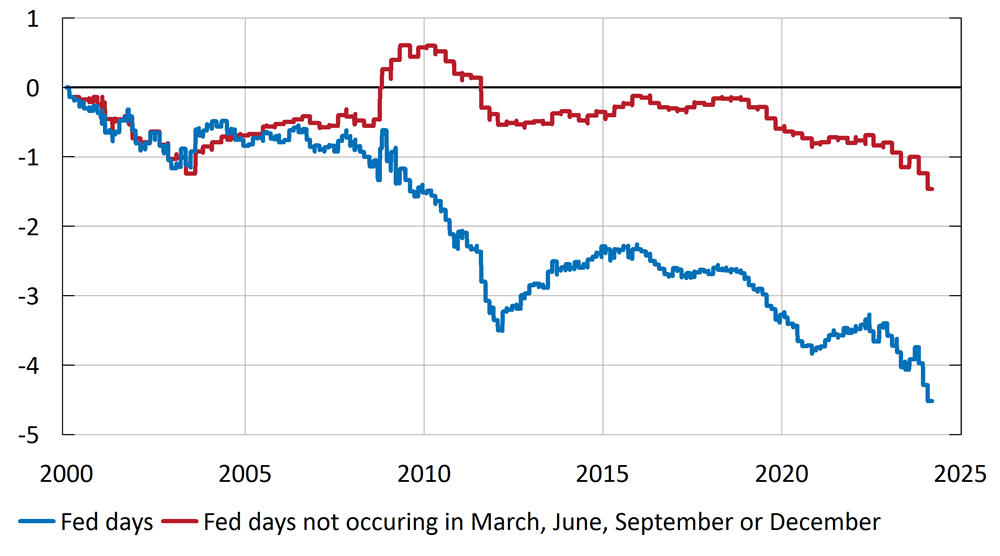
Figure 7. Accumulated changes, 10-year government bond yield, USA around Fed meetings not occurring in March, June, September and December
Percentage points
Note. The lines show hypothetical time series constructed by only taking into consideration the interest rate changes realised in the 3-day window around Fed meetings between 1 January 2000 and 14 March 2024 (blue line) and the interest rate changes realised in the 3-day window around Fed meetings in all months except March, June, September and December (red line). Interest rate changes that occurred on all other days outside this window are set to zero. See, for example, Crump and Lucca (2012) for an analysis and discussion of seasonal patterns in Fed rate setting between 1987 and 2008. They show that during this period the Fed had a greater tendency to cut interest rates in the first month of each quarter. While some of this seasonal pattern can be explained by the timing of meetings, a significant part of the seasonal variation is unexplained. Sources: Federal Reserve and Macrobond.
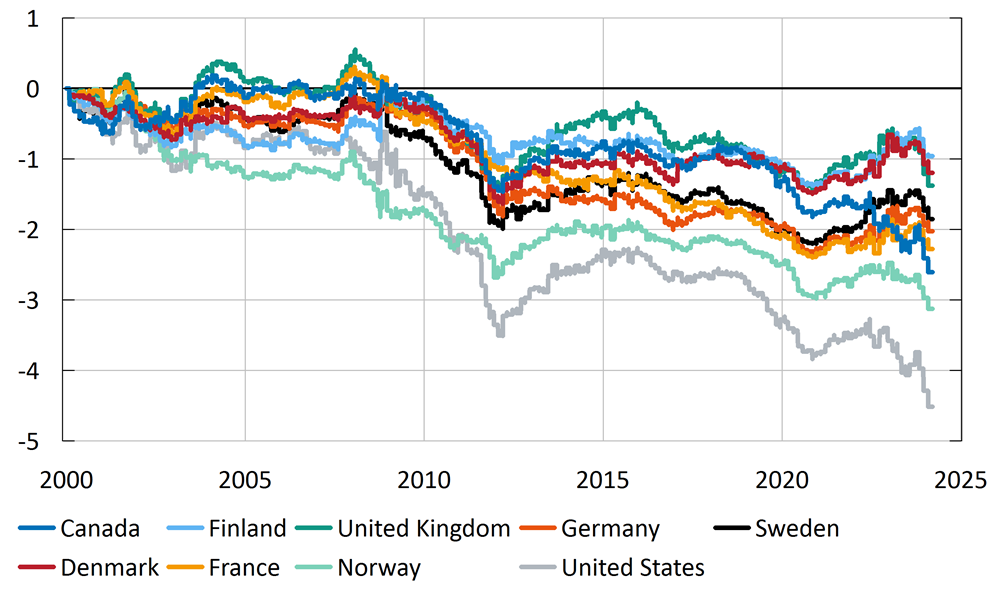
Figure 8. Accumulated changes, 10-year government bond yields, around Fed meetings
Percentage points
Note. The figure shows the cumulative change in the yield on a 10-year government bond in Canada, Denmark, Finland, France, Germany, Norway, Sweden, the United Kingdom and the United States. The lines show hypothetical time series constructed by only taking into account the interest rate changes realised in the 3-day window around Fed meetings between 1 January 2000 and 14 March 2024. Interest rate changes that occurred on all other days outside this window are set to zero. The grey line is the same as the hypothetical time series (blue line) shown in Figure 2. The difference is that the hypothetical series is calculated from 1 January 2000 in this chart but from 1 June 1989 in Figure 2.Sources: Federal Reserve and Macrobond.
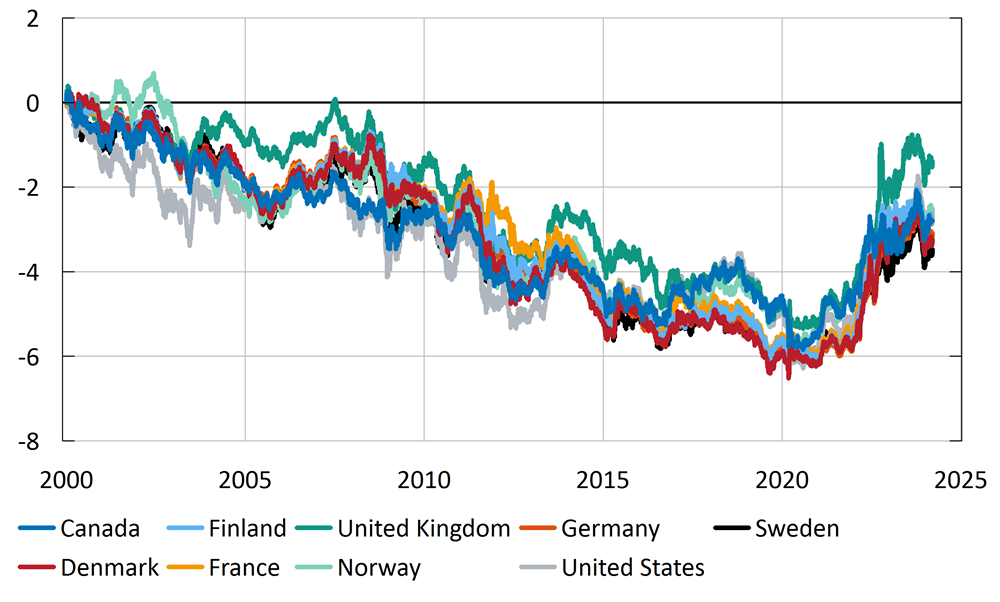
Figure 9. Accumulated changes in nominal government bond yields, 10-year maturity since 1 January 2000
Percentage points
Note. The figure shows the accumulated change in the yield on a 10-year government bond in Canada, Denmark, Finland, France, the United Kingdom, Norway, Germany, the United States and Sweden since 1 January 2000.Source: Macrobond.
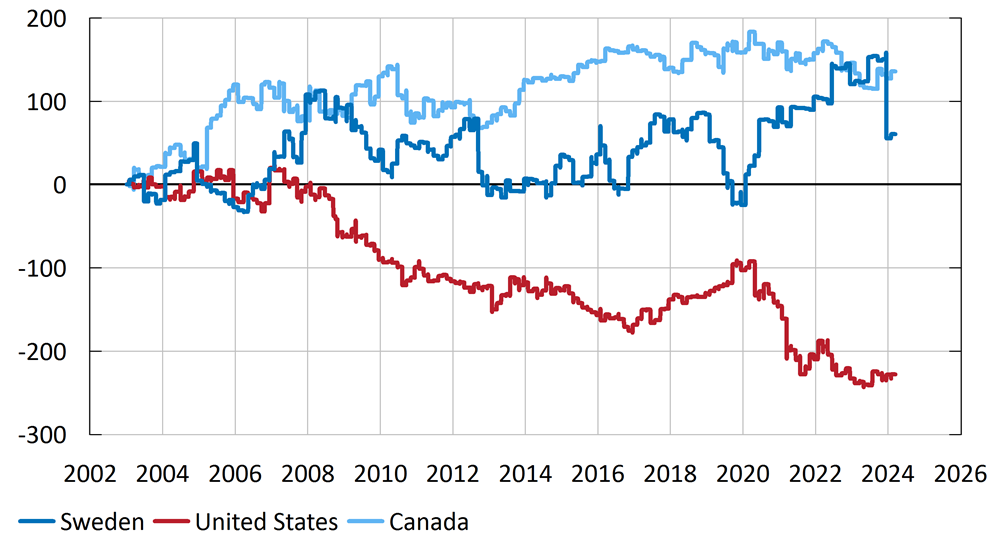
Figure 10. Accumulated changes, Citi, Economic Surprise Index, Sweden, Canada and USA at Fed meetings
Index units
Note. The lines show time series constructed by only taking into account the index changes realised in the 3-day window around the Fed’s monetary policy meetings between 1 January 2000 and 14 March 2024. Index changes that occurred on all other days outside this window are set to zero. The Citigroup Economic Surprise Index represents the sum of the difference between economic outcomes and forecasts. With a sum above 0, outcomes are more positive than market expectations. With a sum below 0, outcomes are generally worse than expected.Sources: Macrobond and own calculations.